SIEM problems
Problems I Faced in Installing ELK Stack on CentOS 9
General Configurations
We use /etc/profile for permanent storage of environmental variables working after a restart.
Selinux file config: /etc/sysconfig/selinux
Firewall Commands
1
2
3
sudo firewall-cmd --permanent --add-port=514/udp
sudo firewall-cmd --permanent --add-port=514/tcp
sudo firewall-cmd --reload
ElasticSearch
The problem that lasted for about 2 days was related to certificates. After installing Elasticsearch on CentOS 9, I got this error when visiting https://localhost:9200:
1
2
3
4
5
6
7
8
9
10
11
12
13
14
15
16
17
{
  "error": {
    "root_cause": [
      {
        "type": "status_exception",
        "reason": "Cluster state has not been recovered yet, cannot write to the [null] index"
      }
    ],
    "type": "authentication_processing_error",
    "reason": "failed to promote the auto-configured elastic password hash",
    "caused_by": {
      "type": "status_exception",
      "reason": "Cluster state has not been recovered yet, cannot write to the [null] index"
    }
  },
  "status": 503
}
The solution was changing the following parameter:
1
cluster.initial_master_nodes: ["localhost.localdomain"]
Kibana
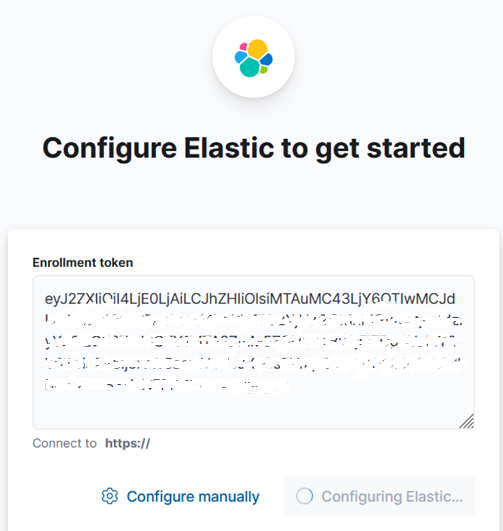
I faced issues when trying to connect Kibana to Elasticsearch using a token. The error I received was due to a mismatch between the certificate’s alternative names and the server IP. The solution was to manually configure the network host:
Error:
1
{"service":{"node":{"roles":["background_tasks","ui"]}},"ecs":{"version":"8.11.0"},"@timestamp":"2024-08-22T12:27:10.910+03:00","message":"Failed to authenticate \"enroll-process-token-1724318822534\" token to host \"https://10.0.7.6:9200\": Hostname/IP does not match certificate's altnames: IP: 10.0.7.6 is not in the cert's list: ::1, 127.0.0.1, 192.168.145.135, fe80::20c:29ff:fe96:edb4.","log":{"level":"ERROR","logger":"plugins.interactiveSetup.elasticsearch"},"process":{"pid":34587,"uptime":1092.41374744},"trace":{"id":"21607abec9b53b1130023016c3809480"},"transaction":{"id":"64a03452c2dbc8ce"}}
Solution:
1
network.publish_host: 127.0.0.1
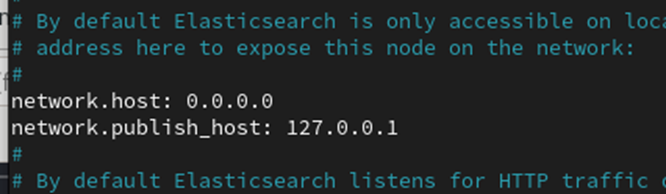
but this did not work with me so i made it manually
Logstash
Running Logstash as a service resulted in certificate errors with Elasticsearch. I resolved this by running Logstash from its own bin directory and manually copying configuration files.
1
2
3
4
mkdir /usr/share/logstash/config
cp /etc/logstash/pipelines.yml /usr/share/logstash/config
cp /etc/logstash/log4j2.properties /usr/share/logstash/config
/usr/share/logstash/bin/logstash